![logo_white_noballoon_735x250.png]](https://help.deedmob.com/hs-fs/hubfs/logo_white_noballoon_735x250.png?width=147&height=40&name=logo_white_noballoon_735x250.png)
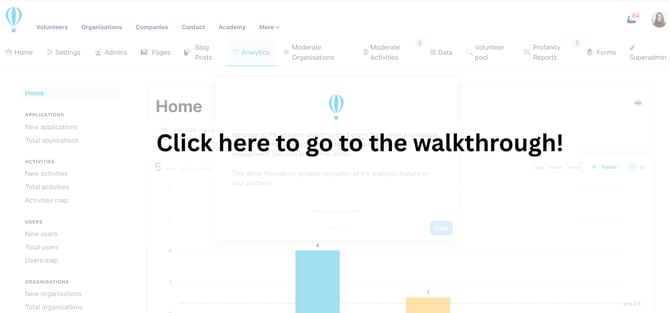
Click on the image below to view the walkthrough for analytics. Read below an overview of the different metrics.
Home
A personalisable wall of charts. By default: new applications, new activities, new users, and new activity hours. Your Home wall of charts (both platform and organization sides) is saved per person, per platform, per browser.
Applications
- New: applications per period, stacked by activity type, plus pies for origin, current status, cause, SDG, and theme.
- Total: application levels over time by activity type, an applications-by-status chart, and the same pies.
Activities
- New: activities created per period by type, cause/SDG/theme pies, a most-visited-new-activities table, and a table of which organisations created them.
- Total: activity levels over time by type, a by-status chart, pies, and the most-visited-activities table.
- Map: activities on a map.
Users
- New: sign-ups per period, cause/theme pies, and a most-active-new-users table.
- Total: total-people level over time, an active-people chart (people who applied in the period), pies, and a most-active-people table (top 20 by applications in the time period).
- Map: people on a map.
Organisations
- New: organisations registered per period, cause/SDG pies, most-active and most-visited new-organisation tables.
- Total: organisation levels over time by type, an active-organisations chart (organisations that posted an activity or received a non-draft application in the period), pies, and most-active/most-visited tables.
- Map: organisations on a map.
Volunteer pool
Only visible if the platform has the volunteer pool switched on. One page with a joins-per-period chart, a pool-size line, a map, and a KPI table:
- Reach-outs — invitations sent to pool members in the time period.
- Approached members — unique volunteers reached.
- Active organisations — distinct organisations that sent at least one reach-out.
- Conversations — reach-outs where the volunteer engaged (status changed to pending).
- Matches — reach-outs that reached accepted status.
- Success ratio — matches ÷ reach-outs.
- Contact ratio — approached members ÷ pool size.
- Leavers — people who opted out during the time period.
- Drop-outs — people automatically removed for inactivity during the time period.
- Pool size — as of the end of the time period.
- A table of organisations using the pool, broken down by reach-out status.
Activity hours
- New: hours recorded per period by activity type, plus origin, status, cause, SDG and theme pies.
- Total: accumulated hours over time, with the same breakdown pies.
- Confirmed hours only by default; filterable to pending or all.
Website
- Unique visitors: visits per period, total visits and average visit duration for the time period, a device-usage breakdown, and a traffic-sources table.
- Page views: page views per period, plus a per-page table, with these metrics:
- Views — total number of times pages were viewed in the time period.
- Unique visitors — number of distinct visitors who viewed a page in the time period.
- Bounce rate — share of visits where someone viewed only one page and left.