Data and analytics for organisation admins and team leaders
Analytics overview. Data overview. Manage volunteering efforts. Provide insights. Visualise impact.
Data and analytics provide organisation admins and team leaders with the means to easily manage their users, applications and activities. It helps organisations with reporting and visualising the impact the organisation is making. Also see: Best practices: how can you use data and analytics within your organisation / team?
- Using analytics you can report on a weekly, monthly, quarterly or yearly basis on a variety of parameters.
- Using the data tables, your organisation page can function as your own CRM, or as a portal to export all information to your current solution.
Together with Activity Reports and Impact Hours our platform provides insightful impact data and analytics on three levels:
-
Activity Reports at the individual level
-
Organisation data & analytics at the organisation level
-
Macro data & analytics at the platform level
PRO TIP: Use the platform as a way to manage ALL your current volunteering efforts within your organisation by adding existing members and activities. This will give your organisation a complete overview of the impact your making.
Data Overview
Organisation data combines all information about users, activities and signups in one place. Using the data tables, your organisation page can function as your own CRM, or as a portal to export all information to your current solution. Also see: Best practices: how can you use data and analytics within your organisation / team?
You can go to the data overview via the organization menu on the left hand side of the organization page. Below you see which data is available.
-
Users: users / members that belong to this organisation or one of its child orgs
-
Opportunities: opportunities belonging to this org or one of its child orgs
-
Applications: applications to opportunties/activities pertaining to this org or one of its child orgs
-
Organization’s impact: Activity Reports connected to this org or one of its child orgs.
-
Members’ impact: Activity Reports by members belonging to this org or one of its child orgs.
-
Organisations: org’s child organisations (teams). If this org has no child organisations, this tab will not be visible.
IMPORTANT: Users, Opportunities and Organisations can be called differently on your platform.
Analytics overview
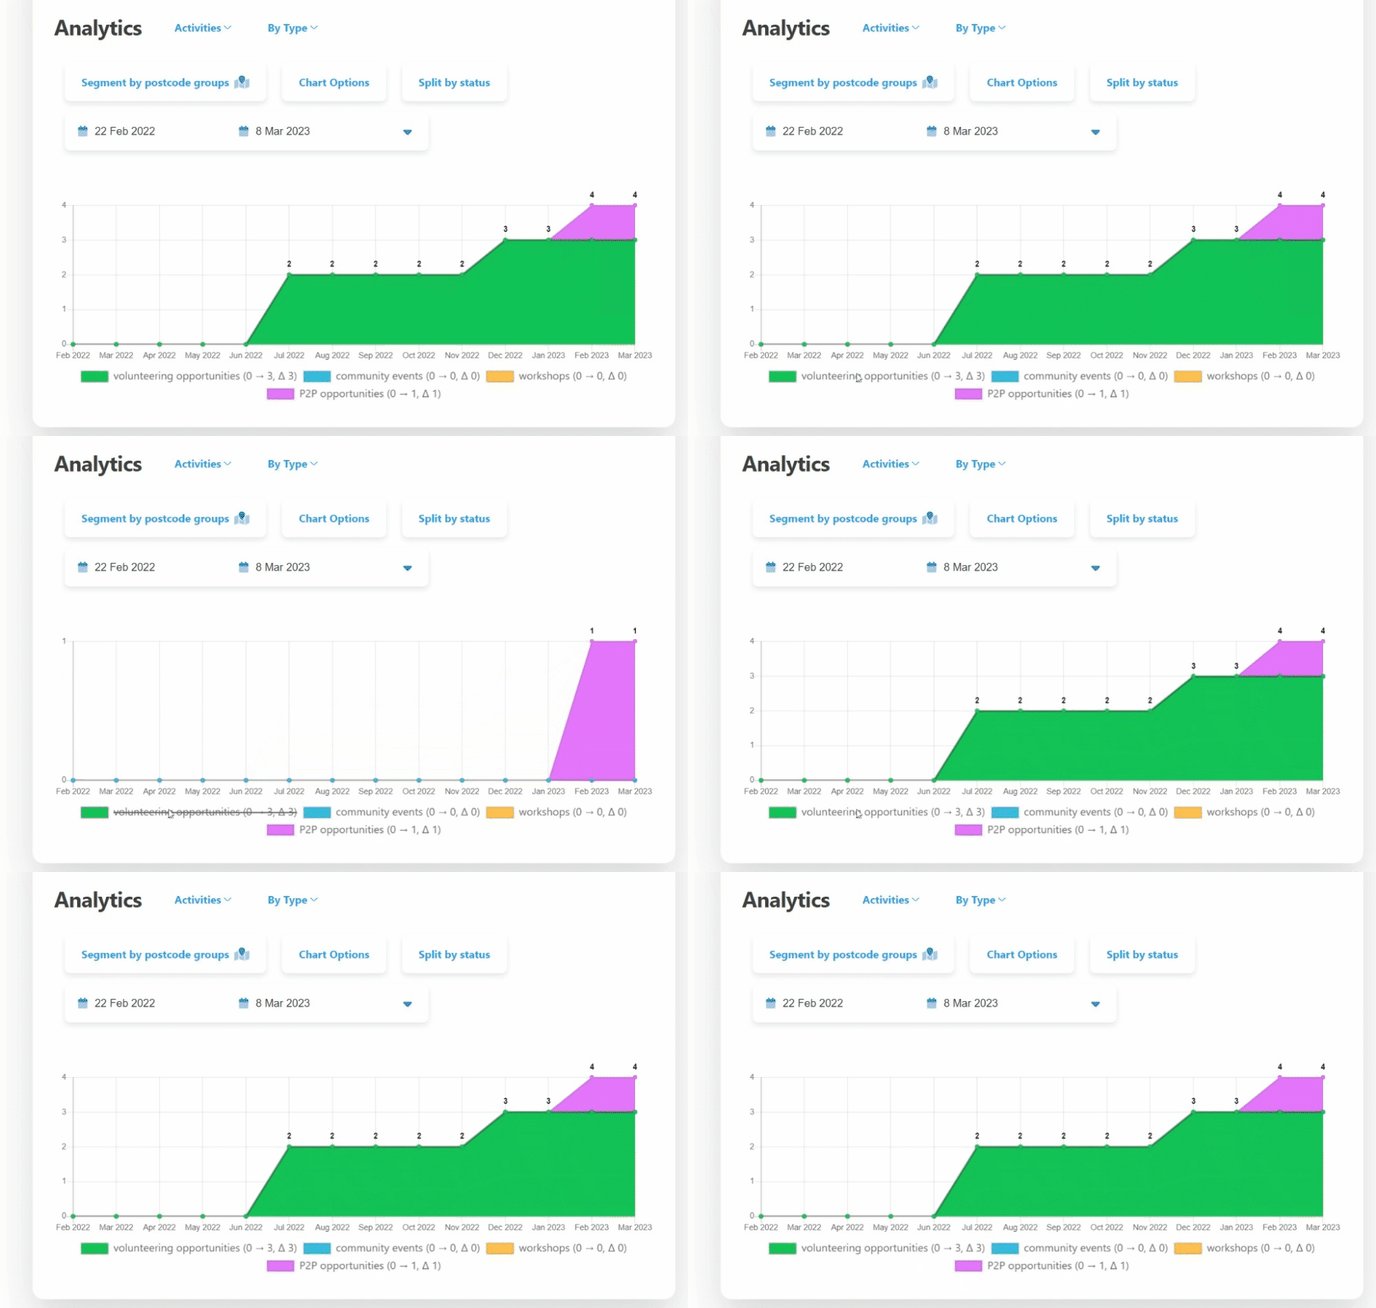
Organisation analytics offer the opportunity for targeted reporting for your organisation. Using analytics you can report on a weekly, monthly, quarterly or yearly basis on a variety of parameters. Also see: Also see: Best practices: how can you use data and analytics within your organisation / team?
You go to the analytics overview via the organization menu on the left side of the organization page. The dropdown at the top lets you choose what Analytics you want to see: Opportunities, Applications, or Organisations (only visible when the organisation uses child organisations / teams). All analytics can be segmented by postcode groups, and by specific dates.
IMPORTANT: Types, Activities, Causes and SDG's can be enabled/disabled and sometimes renamed per platform. The terminlogy might be a little bit different on your platform.
Opportunities displays the number of opportunities.
-
The number of opportunities by Type (e.g. volunteering activity, workshop, community event)
-
Filterable on Status: “Yes/no”
-
-
The number of opportunities by Activities (e.g. Transfer Knowledge, Practical Activities, Trusteeship & coordination, etc.)
-
Filterable on “All Opportunities, Open, or Closed”
-
-
The number of opportunities by Cause (Animal welfare, Poverty reduction, Wellbeing etc.)
-
The number of opportunities by Commitment (Longer than a day, One day)
-
Filterable on “All Opportunities, Open, or Closed”
-
-
The number of opportunities by SDG Goal
-
Only if manually added to opportunities, not estimated
-
-
The number of opportunities on the Map
-
This opens a map where the opportunities take place
-
Filterable on “All Opportunities, Open, or Closed”
-
-
The number of opportunities by Page views
-
This shows how often the URL of an opportunity has been visited
-
Applications displays the number of signups for opportunities by status (Accepted, Declined, Withdrawn, Approached, Pending, Suggested, On Reserve List)
-
The number of applications by Type (e.g. volunteering activity, workshop, community event)
-
The number of applications by Cause (e.g. Transfer Knowledge, Practical Activities, Trusteeship & coordination, etc.)
-
The number of signups by SDG
-
Only if manually added to opportunities, not estimated
-
-
The number of applications by SDG (estimated)
-
Always, estimated by our AI-model in cooperation with CBS (Central Bureau for Statistics in the Netherlands)
-
-
The number of applications by Hours by SDG
-
Only if SDGs are manually added to opportunities, not estimated
-
Only if number of hours are specified in the opportunity
-
-
The number of applications by Origin
-
Reached out to user via volunteer pool by organiser / platform admin
-
User signed up for the opportunity themselves
-
Organisations displays all information pertaining to the organisation and child organisations (teams). This is only visible when the parent organisation has child organisations. This option is not visible for child organisations/teams.
-
The number of (child-)organisations that are monthly active
-
The date of when (child-)organisations are registered
-
(child-)Organisations by cause
-
A table of what interactions a (child-)organisation has had that used volunteer pool and status (Approached, Suggested, Accepted, Pending, Declined, Withdrawn, On Reserve List)
-
What SDGs the (child-)organisations pertain to.
Do you have any questions or would you like to brainstorm about what the numbers mean? Contact your platform administrator.
